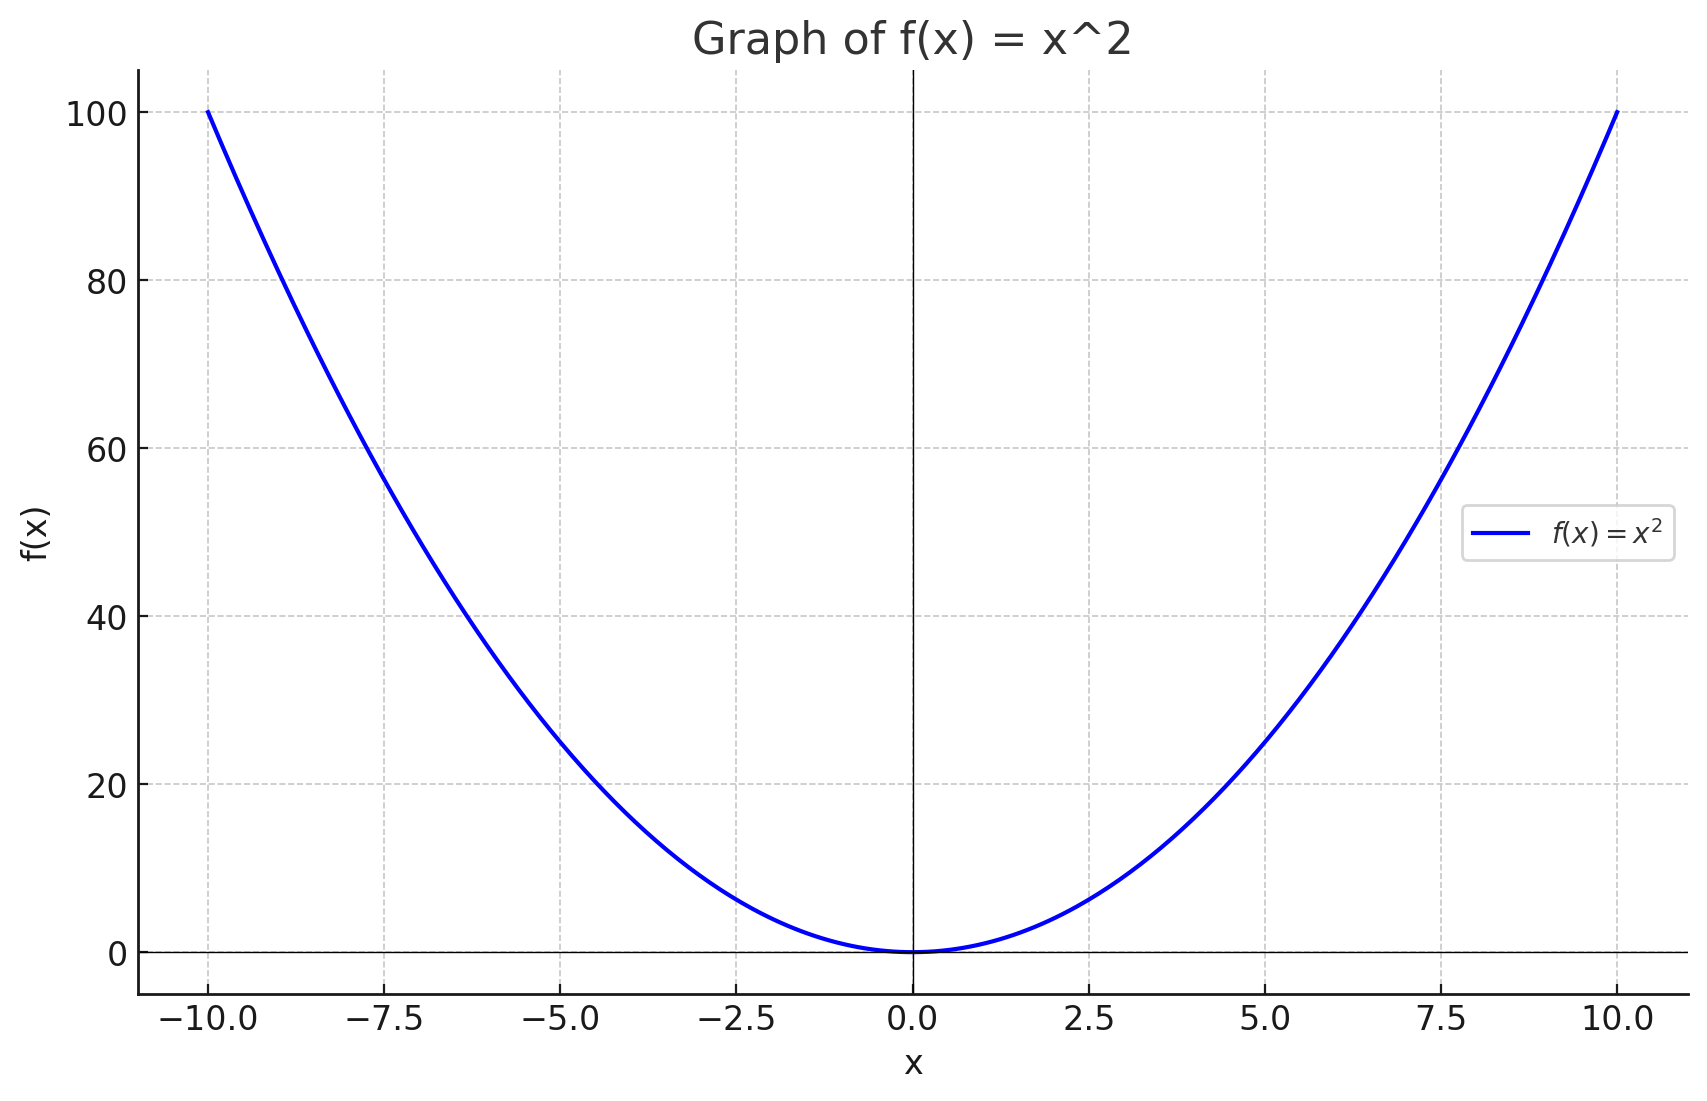
Understanding the End Behavior of a Function
What is End Behavior?
In mathematics, the end behavior of a function describes how the function behaves as the input values (usually represented by ) get very large (positive infinity) or very small (negative infinity). In simple terms, it tells us how the function "moves" as we look further and further to the left or right on the graph.
Example:
Let's consider the function .

- As gets larger and larger (goes to infinity), the function gets bigger and bigger. In this case, the graph goes upward.
- As gets smaller and smaller (goes to negative infinity), the function still gets bigger and bigger (since squaring negative numbers also gives positive results). The graph also moves upward on the left side.
In simple terms:
- End behavior of :
- As (as goes to positive infinity), .
- As (as goes to negative infinity), .
This means, regardless of whether is positive or negative, the function's value keeps increasing as we move further from the origin.
Why is End Behavior Important?
Understanding end behavior helps you know what the graph of the function looks like at the extremes (very large or very small values of ). This can be helpful for making predictions about the function, especially if you only have part of the graph.
How to Describe End Behavior
When we describe the end behavior of a function, we focus on two main things:
- As (when gets very large):
- Does the function go up? Does it go down? Does it flatten out?
- As (when gets very small):
- Again, does the function go up? Does it go down? Does it flatten out?
Example:
Let’s break this down for the function :
- As increases (goes to positive infinity), also increases. The graph goes upward.
- As decreases (goes to negative infinity), still increases. The graph goes upward as well.
So, the end behavior of is:
- As , (the graph goes upward as gets very large).
- As , (the graph goes upward as gets very small).
Graphical Representation Using Python
And if you want, you can use Python to create your own graphs, which will help you better understand it. Here's the Python code that graphs to help visualize its end behavior:
import numpy as np
import matplotlib.pyplot as plt

# Define the function f(x) = x^2
def f(x):
    return x**2

# Create an array of x values from -10 to 10
x = np.linspace(-10, 10, 400)

# Plot the function
plt.plot(x, f(x), label=r'$f(x) = x^2$', color='blue')
plt.axhline(0, color='black',linewidth=0.5)
plt.axvline(0, color='black',linewidth=0.5)

# Labels and title
plt.xlabel('x')
plt.ylabel('f(x)')
plt.title('Graph of f(x) = x^2')

# Show the plot
plt.legend()
plt.grid(True)
plt.show()
Running the code will generate the graph of , and you can see how the graph behaves as approaches positive and negative infinity.
Practice Problem
Problem: What is the end behavior of the function ?
+%3D+-3x%5E2+%2B+5x+-+2%24.png)
Step-by-Step Solution:
- As , the highest degree term is . Since it’s negative, as increases, decreases, so .
- As , the term still dominates. Again, since it’s negative, decreases, so .
So, the end behavior of is:
- As , .
- As , .
Common Mistakes to Avoid
-
Forgetting the degree of the polynomial: The end behavior is mostly determined by the highest degree term. If a function has both positive and negative terms, focus on the term with the highest exponent.
-
Confusing the signs of the leading term: If the leading term has a negative coefficient (like ), the graph will go down as or , so be careful with signs!
Extended Knowledge
-
Horizontal Asymptotes: For rational functions (fractions of polynomials), you might also encounter horizontal asymptotes. These are lines that the graph approaches but never crosses as or .
-
End Behavior for Cubic Functions: For cubic functions (e.g., ), the end behavior is different. The graph will go to positive infinity on one side and negative infinity on the other.